Golang PGO
Profile-guided optimization is a compiler optimization technique that feeds information (a profile) from representative runs of the application back into to the compiler for the next build of the application, which uses that information to make more informed optimization decisions. It was shipped in a preview version in Go 1.20 and made generally available in Go 1.21.
To use PGO you first need to obtain a profile that ideally matches your live traffic pattern. We do by exposing profiling endpoints internally and grabbing a profile from a running application in kubernetes. We register the profiling endpoints during application startup:
func addPProfHandlers(mux *http.ServeMux) {
	//  "allocs":       "A sampling of all past memory allocations",
	//	"block":        "Stack traces that led to blocking on synchronization primitives",
	//	"cmdline":      "The command line invocation of the current program",
	//	"goroutine":    "Stack traces of all current goroutines",
	//	"heap":         "A sampling of memory allocations of live objects. You can specify the gc GET parameter to run GC before taking the heap sample.",
	//	"mutex":        "Stack traces of holders of contended mutexes",
	//	"profile":      "CPU profile. You can specify the duration in the seconds GET parameter. After you get the profile file, use the go tool pprof command to investigate the profile.",
	//	"threadcreate": "Stack traces that led to the creation of new OS threads",
	//	"trace":        "A trace of execution of the current program. You can specify the duration in the seconds GET parameter. After you get the trace file, use the go tool trace command to investigate the trace.",
	mux.HandleFunc("/debug/pprof/", pprof.Index)
	mux.HandleFunc("/debug/pprof/cmdline", pprof.Cmdline)
	mux.HandleFunc("/debug/pprof/profile", pprof.Profile)
	mux.HandleFunc("/debug/pprof/symbol", pprof.Symbol)
	mux.HandleFunc("/debug/pprof/trace", pprof.Trace)
	mux.Handle("/debug/pprof/heap", pprof.Handler("heap"))
	mux.Handle("/debug/pprof/block", pprof.Handler("block"))
	mux.Handle("/debug/pprof/mutex", pprof.Handler("mutex"))
	mux.Handle("/debug/pprof/goroutine", pprof.Handler("goroutine"))
	mux.Handle("/debug/pprof/threadcreate", pprof.Handler("threadcreate"))
}
Then port-forward the running pod in production:
kubectl port-forward $(kubectl get pods -n identity -o name --no-headers=true | grep 'app-name' | head -n 1) http
And grap a profile by running in another terminal session:
curl -o default.pgo http://localhost:8080/debug/pprof/profile\?seconds=30
That’s it. The go build command will automatically enable pgo if it detects default.pgo file in the root directory. As long as you copy the default.pgo profile into your docker image before the build step there are no additional steps required.
You don’t need to have pprof of the latest change to optimize the binary. It is still good idea to update the profile every now and than, especially after major dependency update or code changes.
From the docs:
Go PGO is generally robust to skew between the profiled version of an application and the version building with the profile, as well as to building with profiles collected from already-optimized binaries. This is what makes this iterative lifecycle possible. See the AutoFDO section for additional details about this workflow.
Source stability is achieved using heuristics to match samples from the profile to the compiling source. As a result, many changes to source code, such as adding new functions, have no impact on matching existing code. When the compiler is not able to match changed code, some optimizations are lost, but note that this is a graceful degradation. A single function failing to match may lose out on optimization opportunities, but overall PGO benefit is usually spread across many functions. See the source stability section for more details about matching and degradation.
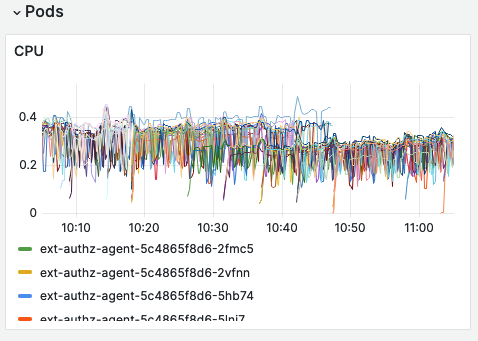
The improvements vary from application to application but in the case of our external authorization agent that is called for almost all requests hitting SumUp APIs we have seen improvement in CPU usage and improvement of p50 latency (hotpath) from ~1.5ms to ~0.75ms.
Profile-guided optimization can be a quick performance improvement for your app for a fairly low effort. The improvements wary but PGO can have a drasticall impact on applications that have only a few hot-paths. Lastly, it’s an interesting novelty in the toolset of compiler provided optimizations.